Built for Professional, National and Division 1 programs. Subscriber feature, for coaches and club owners.
Pro Analytics adds a visual layer on top of your stats. Record plays by tapping where they happen on a court diagram, then see where your team scores, how the ball moves, who's in the water, and what difference each player makes.
Record plays by tapping on a court diagram: where the shot was taken, where it went in the goal, and the passes that led to it. Visual Entry captures the location data that heat maps and ball flow maps are built from.
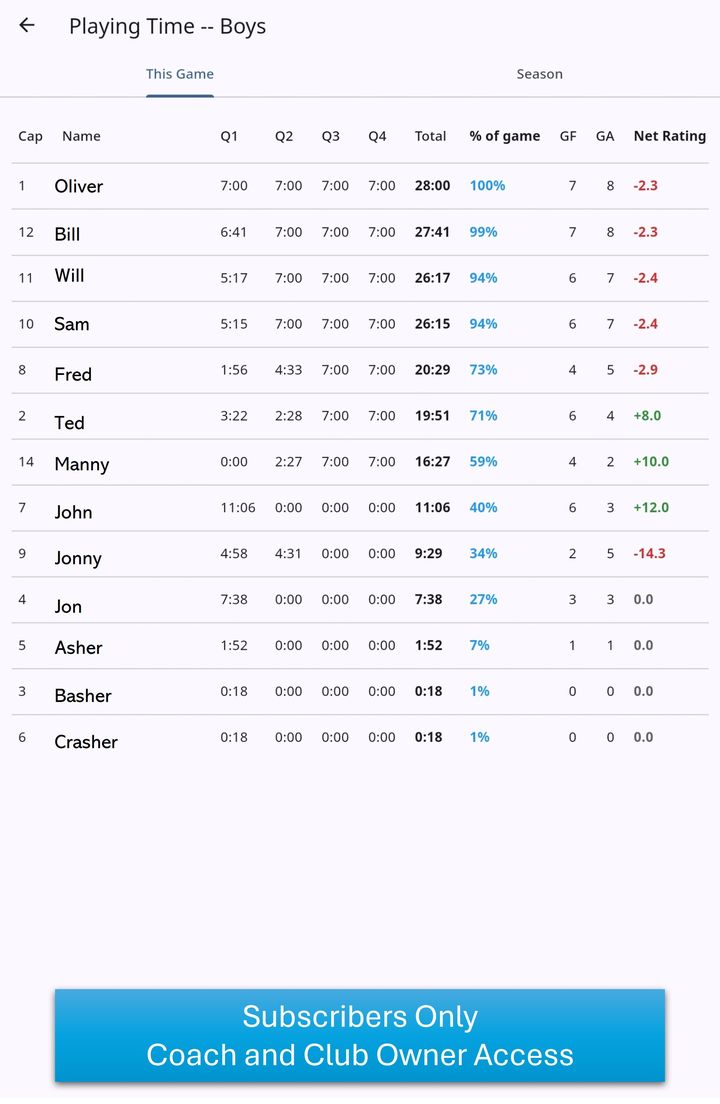
See who's in the water and for how long, for this game or the whole season:
Playing time comes from the game lineup you set when taking stats (see Taking Stats).
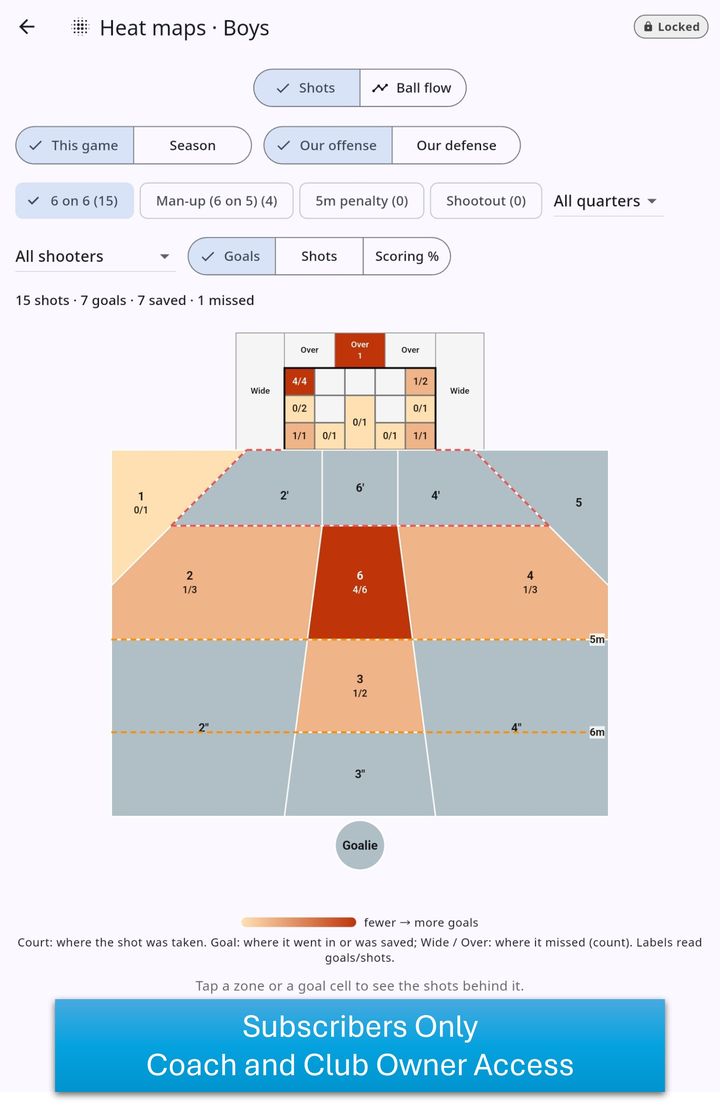
See where shots come from and where they end up. The court shows scoring by zone; the goal shows where shots went in or were saved, and where misses went wide or over. Filter by:
Tap any zone or goal cell to see the shots behind it.
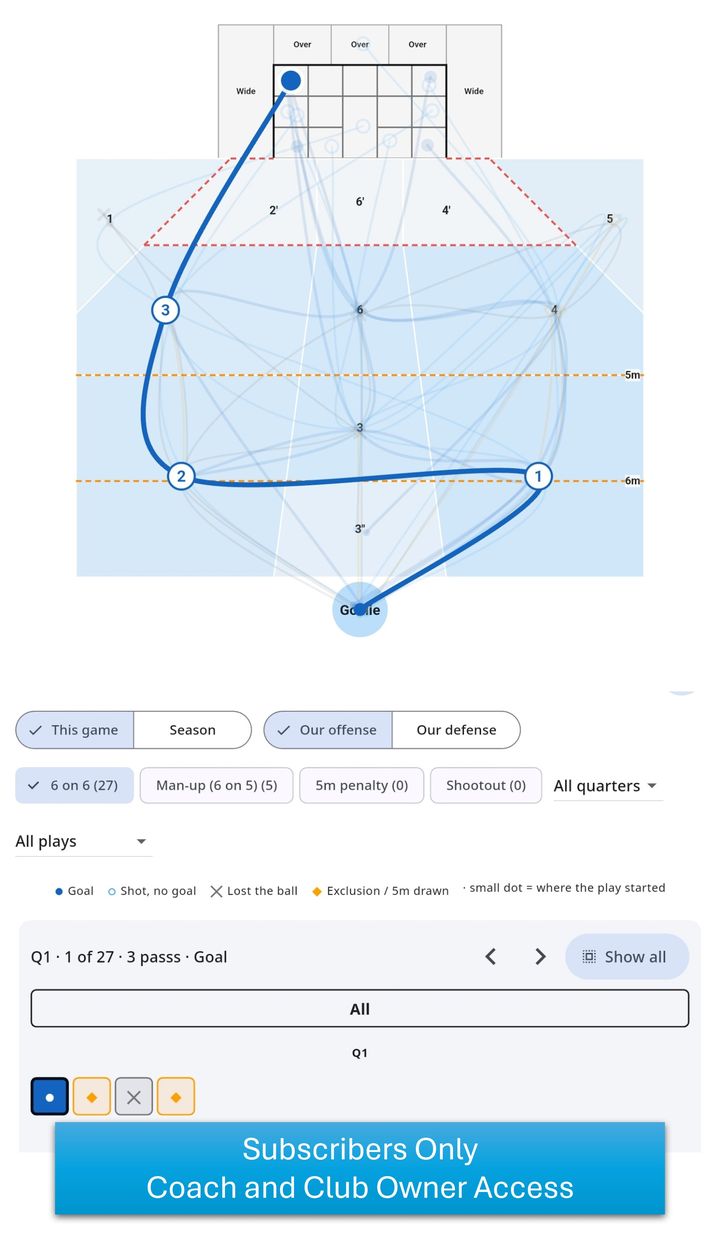
Trace how the ball moves on each possession, pass by pass, from where the play started to how it ended: a goal, a shot without a goal, a lost ball, or an exclusion or 5m penalty drawn. Step through plays one at a time, or show them all to spot patterns.
See which plays and situations produce goals and which end in turnovers, so you know what to keep running and what to fix in practice.
Go beyond goals and assists. Net Rating shows how the team performs while each player is in the water, alongside their goals for, goals against and share of the game played.
See Plans for everything a subscription includes.
 Water Polo Stats